Statistics
The water rates over the years have gone up gradually. The 2010 average annual residential water rate in Ohio The graph below shows the range of water rates charged by communities in 2010. Out of 529 water systems, 261, or about 50%, reported a rate increase during 2010. With all the data that was gathered from 1984-2010 we can assume that as the years go by, the water rates will keep on increasing

Water Rates Graph
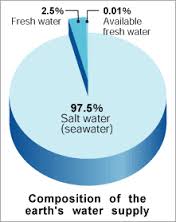
Most people don't know that earth is made up of 75% water. 97% of that is salt water. Out of that 97%, a measly 3% is freshwater. Around 2% is locked up in glaciers. That leaves us with a whopping 1% of actual drinking water! |
|
Not only do we have 1% of earths water for drinking, but also we are just wasting it on baths that take 30-45 gallons! |
As humans we waste a lot of water every day such as when we, bath instead of shower, or when we leave the sink running when we brush our teeth. All these may seem small, but they are huge factors when it comes to wasting water.
|
